
Menu
Menu
Finance
Smart Financial Management Mobile App
Smart Financial Management Mobile App
Smart Financial Management Mobile App
MoneyNest empowers young adults to take control of their finances by simplifying budgeting, saving, and expense tracking with intuitive, automated tools
MoneyNest empowers young adults to take control of their finances by simplifying budgeting, saving, and expense tracking with intuitive, automated tools


Industry
Industry
Finance Management
Finance Management
Role
Role
UX/UI Designer
UX/UI Designer
Project Timeline
Project Timeline
2024
2024
Tools
Tools
Figma, Miro,Photoshop, Monday
Figma, Miro,Photoshop, Monday
Challenge
Challenge
Young adults in the UK struggle with financial management due to low financial literacy, poor budgeting habits, and inconsistent saving. Many face credit card debt and lack access to engaging tools for financial education and planning, highlighting the need for a modern, accessible solution.
Young adults in the UK struggle with financial management due to low financial literacy, poor budgeting habits, and inconsistent saving. Many face credit card debt and lack access to engaging tools for financial education and planning, highlighting the need for a modern, accessible solution.
Solution
Solution
Money Nest addresses these challenges through insights from user interviews and research, focusing on key pain points like time-consuming manual tracking. The app offers expense categorization, automated tracking, spending comparisons, personalized financial tips, and budget reminders—delivering practical, user-friendly features tailored to users’ needs.
Money Nest addresses these challenges through insights from user interviews and research, focusing on key pain points like time-consuming manual tracking. The app offers expense categorization, automated tracking, spending comparisons, personalized financial tips, and budget reminders—delivering practical, user-friendly features tailored to users’ needs.
Business Objectives
Business Objectives
Business Objectives
Improve confidence among users.
Encourage consistent savings habits through personalized tools.
Increase adoption of digital banking platforms.
Address pain points in saving and spending
Boost user retention with innovative, user-focused solutions.
Improve confidence among users.
Encourage consistent savings habits through personalized tools.
Increase adoption of digital banking platforms.
Address pain points in saving and spending
Boost user retention with innovative, user-focused solutions.
Improve confidence among users.
Encourage consistent savings habits through personalized tools.
Increase adoption of digital banking platforms.
Address pain points in saving and spending
Boost user retention with innovative, user-focused solutions.
Expected Outcomes
Expected Outcomes
Expected Outcomes
Higher adoption rates of digital banking services.
Growth in users meeting their monthly savings goals.
Valuable insights into spending and saving behaviors.
Enhanced user satisfaction and retention through improved app features.
Users feel more confident managing their finances.
Higher adoption rates of digital banking services.
Growth in users meeting their monthly savings goals.
Valuable insights into spending and saving behaviors.
Enhanced user satisfaction and retention through improved app features.
Users feel more confident managing their finances.
Higher adoption rates of digital banking services.
Growth in users meeting their monthly savings goals.
Valuable insights into spending and saving behaviors.
Enhanced user satisfaction and retention through improved app features.
Users feel more confident managing their finances.
check out the final prototypes In Figma
check out the final prototypes In Figma
check out the final prototypes In Figma
Design Thinking Process
Design Thinking Process
Design Thinking Process
Desk Research
Desk Research
Desk Research
How Can Fintech Innovations Support Better Financial Decision-Making?
How Can Fintech Innovations Support Better Financial Decision-Making?
How Can Fintech Innovations Support Better Financial Decision-Making?
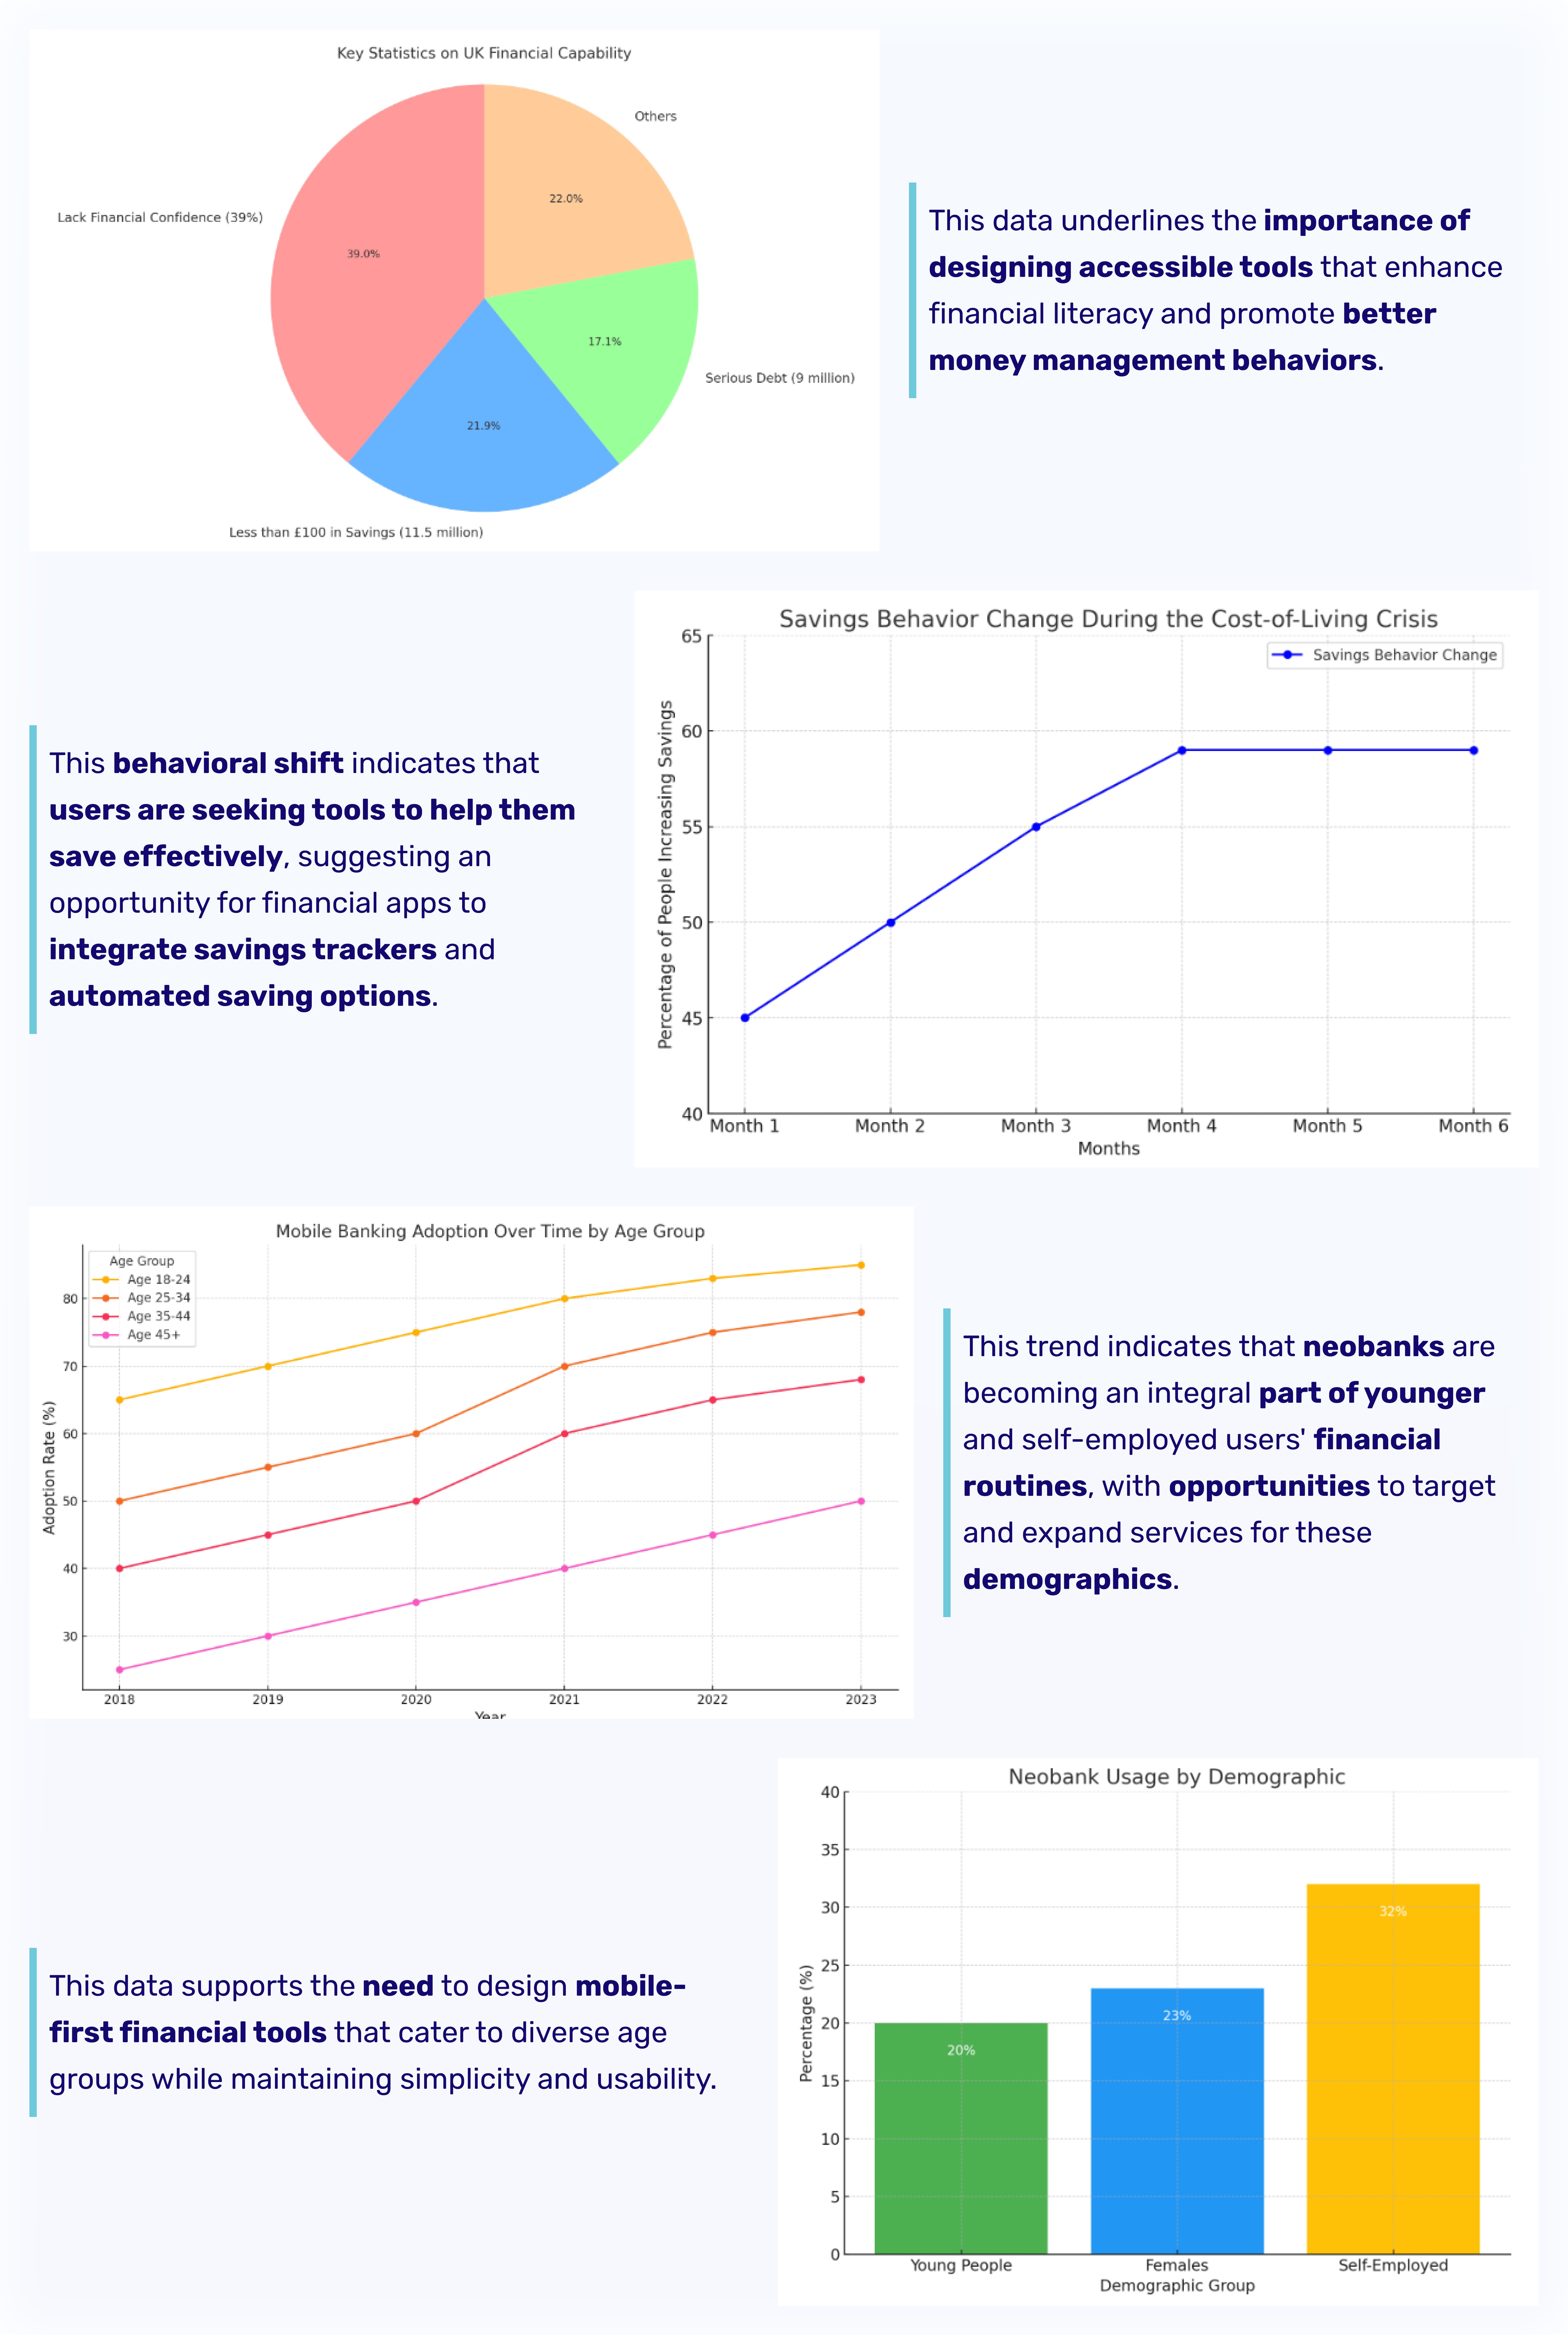
This research aimed to explore changing financial behaviors and trends among UK consumers during the cost-of-living crisis and the rise of neobanks, uncovering pain points and opportunities for fintech innovation through data analysis and user interviews.
This research aimed to explore changing financial behaviors and trends among UK consumers during the cost-of-living crisis and the rise of neobanks, uncovering pain points and opportunities for fintech innovation through data analysis and user interviews.
This research aimed to explore changing financial behaviors and trends among UK consumers during the cost-of-living crisis and the rise of neobanks, uncovering pain points and opportunities for fintech innovation through data analysis and user interviews.
User Interviews
User Interviews
User Interviews
During the interviews with five users, I asked a range of questions to understand their financial management practices, challenges, and preferences. Some key questions included:
During the interviews with five users, I asked a range of questions to understand their financial management practices, challenges, and preferences. Some key questions included:
During the interviews with five users, I asked a range of questions to understand their financial management practices, challenges, and preferences. Some key questions included:
How do you currently manage your finances? (to understand their preferred tools and methods)
How often do you review your finances, and what challenges do you face during this process? (to identify pain points and barriers to regular tracking)
What features do you look for in a financial management app? (to gather insights into user expectations and preferences for app features)
How do you handle impulse purchases, and what tools could help you with responsible spending? (to explore their spending behaviors and needs for improved financial control)
Would you prefer an app that integrates with your bank for easier tracking, or do you prefer manual methods? (to assess the appeal of integrated solutions versus traditional approaches)
Summarizing Insights
Summarizing Insights
Summarizing Insights
The affinity diagram shows key findings from user interviews, offering a comprehensive view of financial management practices, challenges, preferences, behaviors, and suggestions for app improvements.
The affinity diagram shows key findings from user interviews, offering a comprehensive view of financial management practices, challenges, preferences, behaviors, and suggestions for app improvements.
The affinity diagram shows key findings from user interviews, offering a comprehensive view of financial management practices, challenges, preferences, behaviors, and suggestions for app improvements.
Users prefer bank apps for financial management due to their convenience and trust.
Users review finances monthly, though the process feels stressful, hindering regular tracking.
Manual Excel input is time-consuming and inefficient.
Users often engage in impulse purchases, but desire visual reminders and insights to foster responsible spending and help achieve financial goals.
Connect to Content
Add layers or components to infinitely loop on your page.
Connect to Content
Add layers or components to infinitely loop on your page.

UX Designer
fmohammadzadeh028@gmail.com
Let’s connect!
Connect to Content
Add layers or components to infinitely loop on your page.
Connect to Content
Add layers or components to infinitely loop on your page.
UX Designer
fmohammadzadeh028@gmail.com
Let’s connect!
© 2024. Designed by Fatemeh Mohammadzadeh
Assumptions
Assumptions
Assumptions
In this case, I’ve divided our assumptions into two categories: business assumptions and user assumptions. Each type of assumption is key to shaping our approach, ensuring we meet both our goals and our users' needs.
In this case, I’ve divided our assumptions into two categories: business assumptions and user assumptions. Each type of assumption is key to shaping our approach, ensuring we meet both our goals and our users' needs.
In this case, I’ve divided our assumptions into two categories: business assumptions and user assumptions. Each type of assumption is key to shaping our approach, ensuring we meet both our goals and our users' needs.

Prioritizations
Prioritizations
Prioritizations
To prioritize assumptions effectively, I used the Risk/Uncertainty Matrix to assess the feasibility of solutions versus their impact on user experience and business objectives. This approach helped me focus on solutions with the highest impact and least effort, ensuring the most important assumptions are addressed first, aligning the project with user needs and business goals.
To prioritize assumptions effectively, I used the Risk/Uncertainty Matrix to assess the feasibility of solutions versus their impact on user experience and business objectives. This approach helped me focus on solutions with the highest impact and least effort, ensuring the most important assumptions are addressed first, aligning the project with user needs and business goals.
To prioritize assumptions effectively, I used the Risk/Uncertainty Matrix to assess the feasibility of solutions versus their impact on user experience and business objectives. This approach helped me focus on solutions with the highest impact and least effort, ensuring the most important assumptions are addressed first, aligning the project with user needs and business goals.
Business
Business
Business
User
User
User

User Persona
User Persona
User Persona
Based on the research results and data collected, the target audience are Millennials and Gen Z, typically aged between 18 and 30. They are seeking ways to save money and improve their financial management skills. They prefer user-friendly tools that can assist them in achieving their financial objectives.
Based on the research results and data collected, the target audience are Millennials and Gen Z, typically aged between 18 and 30. They are seeking ways to save money and improve their financial management skills. They prefer user-friendly tools that can assist them in achieving their financial objectives.
Based on the research results and data collected, the target audience are Millennials and Gen Z, typically aged between 18 and 30. They are seeking ways to save money and improve their financial management skills. They prefer user-friendly tools that can assist them in achieving their financial objectives.

Customer Journey Map & Service Design
Customer Journey Map & Service Design
Customer Journey Map & Service Design
The Customer Journey Map visualizes the steps, emotions, and challenges users face when managing their finances. To complement this, the Service Design framework ensures that all touchpoints and backend processes—from app onboarding to personalized insights—work seamlessly together to support the user journey.
This combined approach reveals not only the user's pain points but also opportunities to optimize the underlying systems, ensuring a consistent, user-focused experience that aligns with the app's business objectives.


Competitors
Competitors
Competitors
To better understand the landscape of financial management tools, I analyzed two competitors: Hint and YNAB (You Need A Budget). This evaluation focused on their features, strengths, and weaknesses to identify opportunities and gaps for my app's development.
To better understand the landscape of financial management tools, I analyzed two competitors: Hint and YNAB (You Need A Budget). This evaluation focused on their features, strengths, and weaknesses to identify opportunities and gaps for my app's development.
To better understand the landscape of financial management tools, I analyzed two competitors: Hint and YNAB (You Need A Budget). This evaluation focused on their features, strengths, and weaknesses to identify opportunities and gaps for my app's development.

From the analysis, I identified key opportunities:
Visual Insights: Lack of intuitive, engaging visual tools for tracking.
Personalization: Limited tailoring to individual financial behaviors and goals.
Ease of Use: Onboarding and manual inputs need simplification.
Impulse Control Tools: Few features to prevent overspending (e.g., alerts or reminders).
Integrated Features: Fragmentation in combining savings, budgeting, and spending insights.
These gaps informed my app's focus on personalization, seamless integration, and a user-friendly experience.
Ideation
Ideation
Ideation
During the Ideation phase, I utilized the 6-Up Template to generate diverse design ideas quickly. This method helped explore multiple solutions for user pain points and opportunities identified during research.
During the Ideation phase, I utilized the 6-Up Template to generate diverse design ideas quickly. This method helped explore multiple solutions for user pain points and opportunities identified during research.
During the Ideation phase, I utilized the 6-Up Template to generate diverse design ideas quickly. This method helped explore multiple solutions for user pain points and opportunities identified during research.

To prioritize these ideas, I applied the MoSCoW Method. This framework allowed me to classify features based on their importance and feasibility, ensuring the most critical solutions aligned with both user needs and business objectives were implemented first.
To prioritize these ideas, I applied the MoSCoW Method. This framework allowed me to classify features based on their importance and feasibility, ensuring the most critical solutions aligned with both user needs and business objectives were implemented first.
To prioritize these ideas, I applied the MoSCoW Method. This framework allowed me to classify features based on their importance and feasibility, ensuring the most critical solutions aligned with both user needs and business objectives were implemented first.

Mental Model
Mental Model
Mental Model
After ideation, I developed a Mental Model to align the app's structure with users' thought processes and behaviors around financial management.
After ideation, I developed a Mental Model to align the app's structure with users' thought processes and behaviors around financial management.
After ideation, I developed a Mental Model to align the app's structure with users' thought processes and behaviors around financial management.
Key Components of the Mental Model
Goal Setting: Define clear financial goals (e.g., saving for a trip).
Tracking Progress: Visual, real-time updates on spending and savings.
Budgeting: Simplified tools with adjustable options.
Impulse Control: Alerts to curb overspending and stay disciplined.
Reviewing Finances: Easy access to summaries and actionable insights.
This model shaped the app's information architecture and key workflows, ensuring that the design supports users' mental frameworks, reduces cognitive load, and enhances usability.
This model shaped the app's information architecture and key workflows, ensuring that the design supports users' mental frameworks, reduces cognitive load, and enhances usability.
This model shaped the app's information architecture and key workflows, ensuring that the design supports users' mental frameworks, reduces cognitive load, and enhances usability.

Hypotheses & Prioritisation
Hypotheses & Prioritisation
Hypotheses & Prioritisation
I outlined key hypotheses derived from user research and competitor analysis to guide the app's development.
I outlined key hypotheses derived from user research and competitor analysis to guide the app's development.
I outlined key hypotheses derived from user research and competitor analysis to guide the app's development.
To prioritize these hypotheses, I used a Perceived Value vs. Risk Matrix, categorizing each hypothesis based on its potential value to users and the risks involved in implementation:
High Value, Low Risk: Focused on features like visual insights and reminders, as these directly enhance user experience with minimal implementation challenges.
High Risk, High Value: Addressed through small experiments to test complex features like real-time AI-driven budget recommendations.
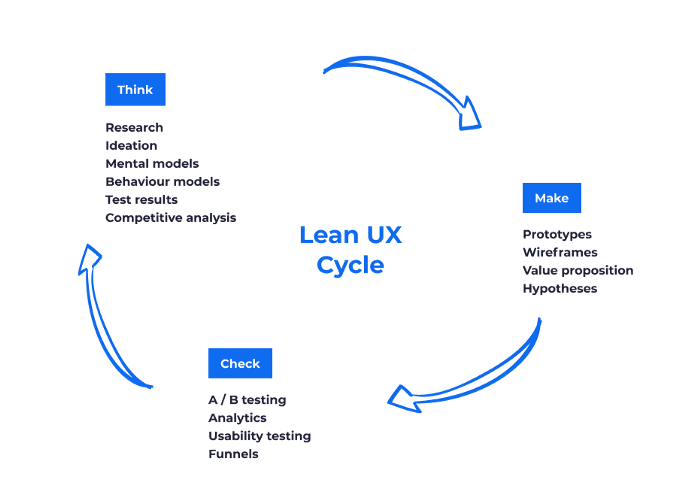
Lean UX Canvas
Lean UX Canvas
Lean UX Canvas
To refine these priorities, I used the Lean UX Canvas to structure and validate each hypothesis. This framework helped define:
User Problems: Key pain points like stress during financial tracking and manual processes.
Solutions: Potential features such as automated insights and goal-setting tools.
Risks: Challenges like ensuring data accuracy or user trust in AI-generated insights.
Metrics: Success measures like increased savings or reduced time spent managing finances.
By combining the matrix and Lean UX Canvas, I systematically tested and iterated on hypotheses, focusing on delivering maximum user value while mitigating risks effectively.

Prototypes
Prototypes
Prototypes
As part of the Lean UX approach, I focused on rapid iterations and quick validation, which meant skipping the mid-fidelity phase. Instead, I moved from paper sketches directly to a high-fidelity prototype to ensure that the design could be tested and refined efficiently.
As part of the Lean UX approach, I focused on rapid iterations and quick validation, which meant skipping the mid-fidelity phase. Instead, I moved from paper sketches directly to a high-fidelity prototype to ensure that the design could be tested and refined efficiently.
As part of the Lean UX approach, I focused on rapid iterations and quick validation, which meant skipping the mid-fidelity phase. Instead, I moved from paper sketches directly to a high-fidelity prototype to ensure that the design could be tested and refined efficiently.

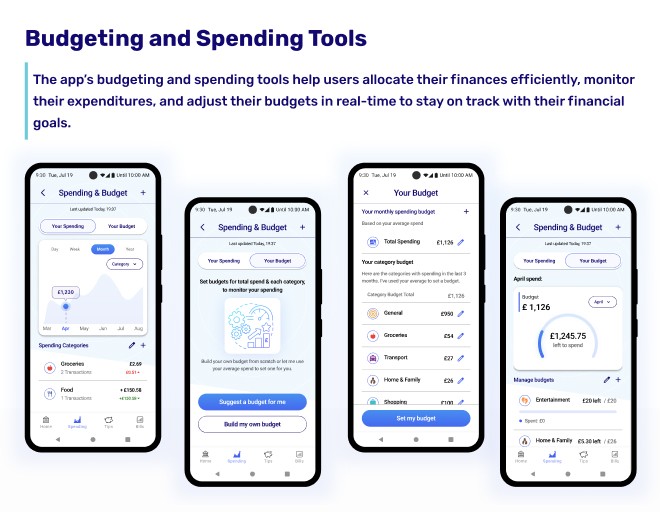
The style guide ensured consistency across the prototype, outlining key UI elements like buttons, input fields, and navigation components.
The style guide ensured consistency across the prototype, outlining key UI elements like buttons, input fields, and navigation components.
The style guide ensured consistency across the prototype, outlining key UI elements like buttons, input fields, and navigation components.

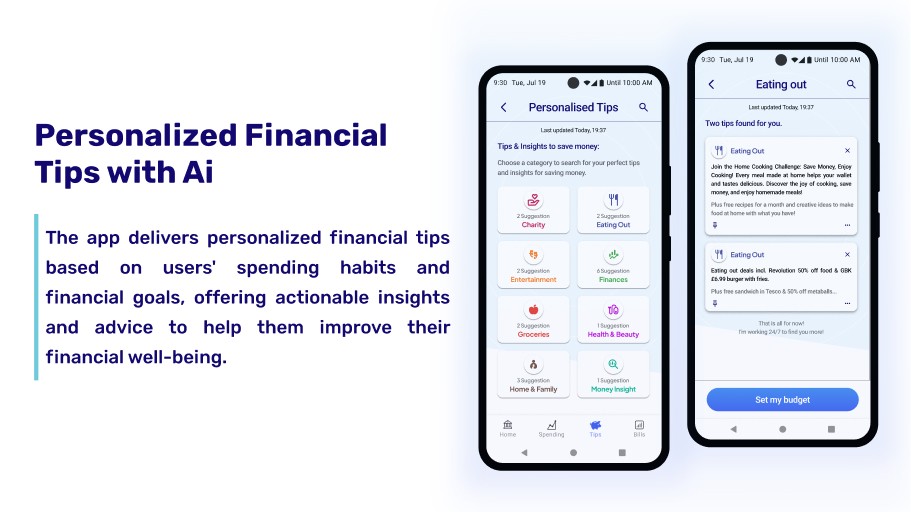
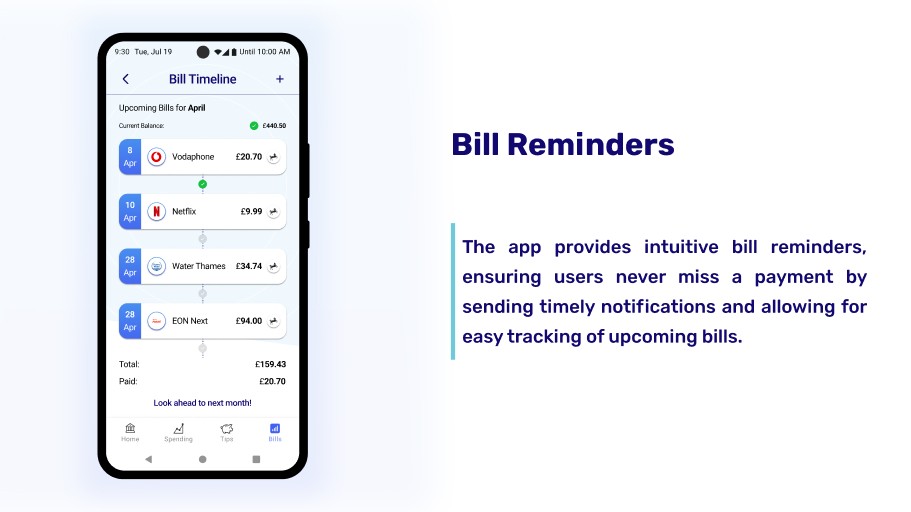
High-Fidelity UI Screens
High-Fidelity UI Screens
High-Fidelity UI Screens

Usability Test Overview
Usability Test Overview
Usability Test Overview
Participants: 5 UK students, aged up to 30, tested via Microsoft Teams using the "think out loud" method.
Participants: 5 UK students, aged up to 30, tested via Microsoft Teams using the "think out loud" method.
Participants: 5 UK students, aged up to 30, tested via Microsoft Teams using the "think out loud" method.
Test Metrics
Test Metrics
Test Metrics
Time on task
Errors encountered
Assistance needed
Task completion rate
Time on task
Errors encountered
Assistance needed
Task completion rate
Time on task
Errors encountered
Assistance needed
Task completion rate
Hypotheses & Tasks
Hypotheses & Tasks
Hypotheses & Tasks
Engagement & Retention: Test access to financial features, manage cards, and view bills.
Premium Conversion: Test categorizing spending and visualizing habits.
Customer Satisfaction: Test security features (third-party login, passcode).
Brand Reputation: Test bank account integration process.
Churn & Lifetime Value: Test personalized tips and spending categories.
Financial Management: Test managing upcoming/past bills.
Key Takeaways
Key Takeaways
Key Takeaways
100% task completion rate.
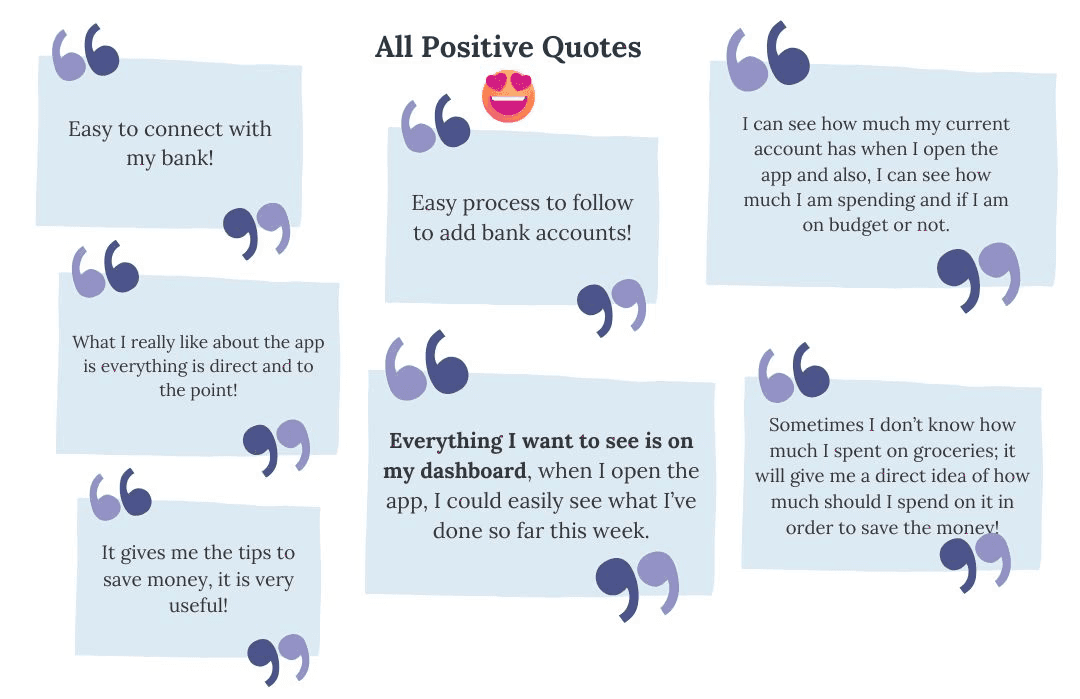
Positive feedback on app navigation, security, and budgeting tools.
Hypotheses validated, meeting user needs and business goals with no major issues.
100% task completion rate.
Positive feedback on app navigation, security, and budgeting tools.
Hypotheses validated, meeting user needs and business goals with no major issues.
100% task completion rate.
Positive feedback on app navigation, security, and budgeting tools.
Hypotheses validated, meeting user needs and business goals with no major issues.
Future Work
Future Work
Future Work
Refining Features: Enhance core features based on feedback, including personalized budget tools and premium offers.
Revenue Generation: Introduce premium subscriptions and partner with third parties for targeted deals.
Growth Strategy: Implement social referral programs and refine both free and premium versions to drive growth and retention.
Connect to Content
Add layers or components to infinitely loop on your page.
Connect to Content
Add layers or components to infinitely loop on your page.
Connect to Content
Add layers or components to infinitely loop on your page.
fmohammadzadeh028@gmail.com - User Experience Designer
Let’s connect !
© 2024. Designed by Fatemeh Mohammadzadeh
Connect to Content
Add layers or components to infinitely loop on your page.
Connect to Content
Add layers or components to infinitely loop on your page.
Connect to Content
Add layers or components to infinitely loop on your page.
fmohammadzadeh028@gmail.com - User Experience Designer
Let’s connect !
© 2024. Designed by Fatemeh Mohammadzadeh